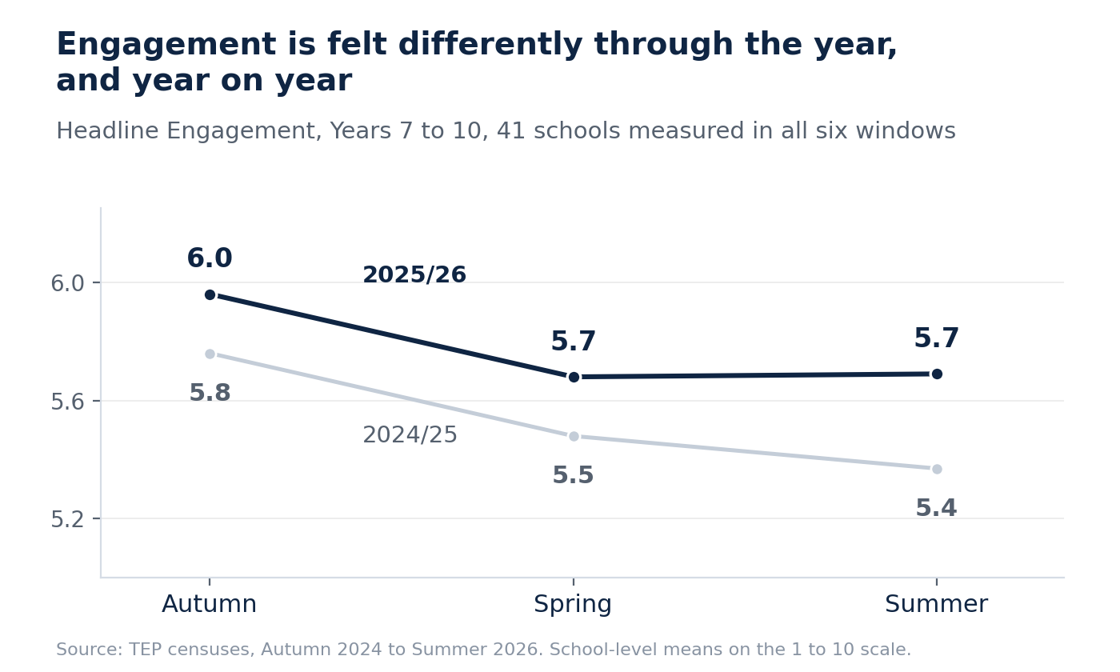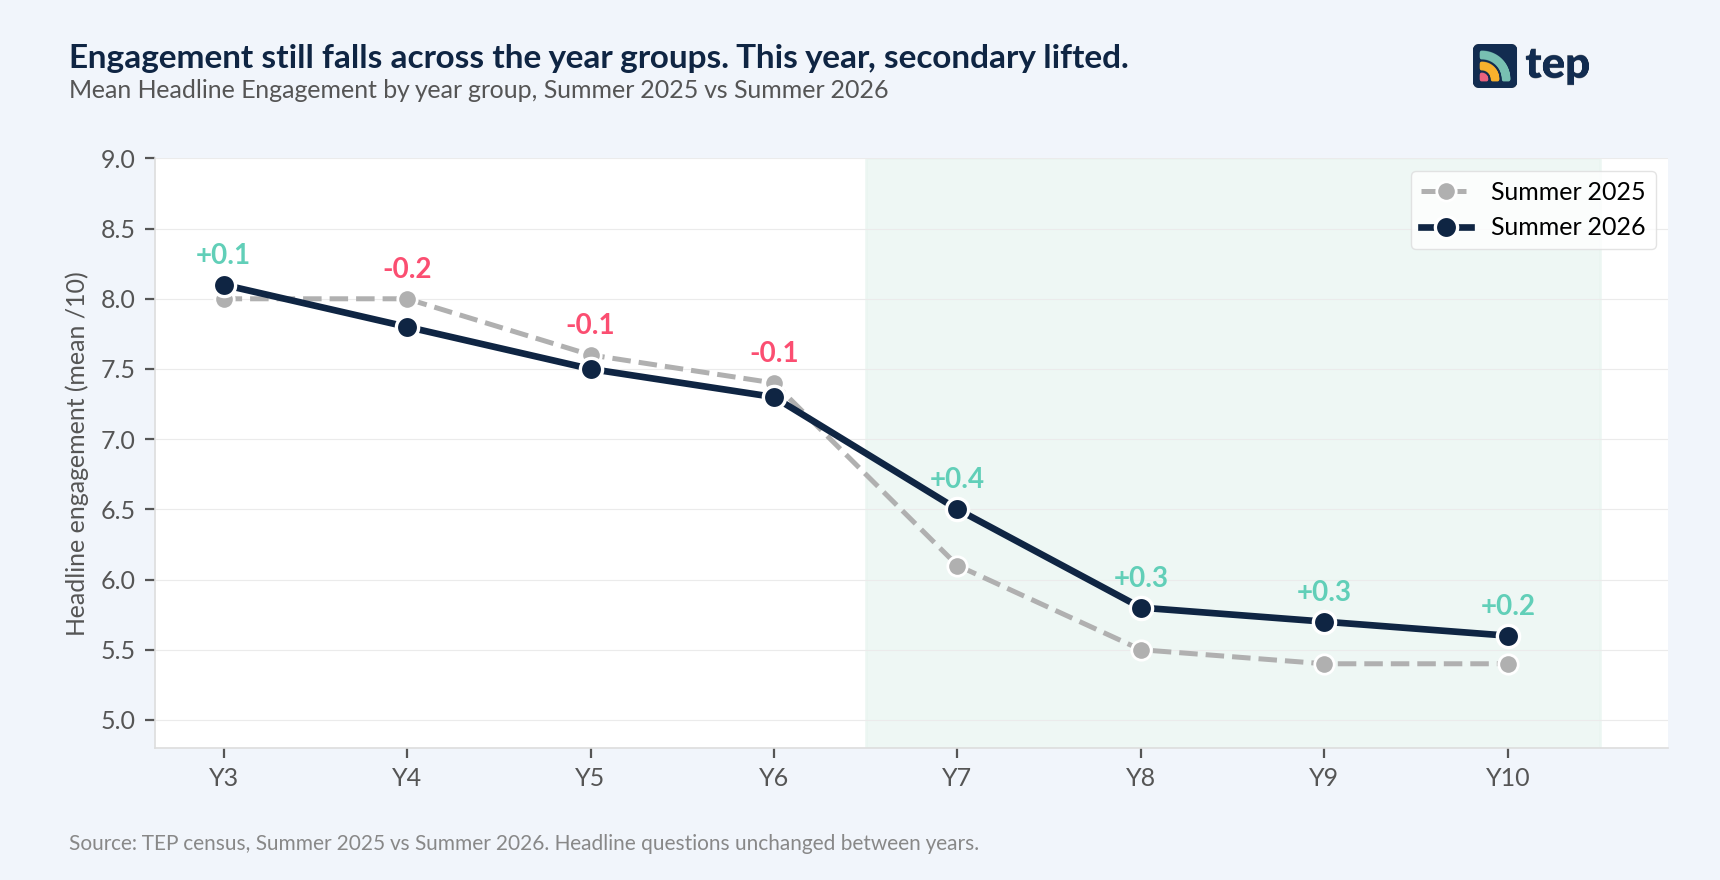






You’ve collected feedback from your entire school community, three times per year, and you can see the picture at your school against the national benchmark. The Engagement Platform (TEP) has broken those results down by driver, question and demographic. Which leaves the question leaders ask of any data; so what? As we enter the new academic year, we’re here to help you answer it: to use this data to underpin decision making and target resources where they are needed most. We’ve collated our national research and spoken to three school leaders whose employee headline engagement scores showed improvements between Autumn 2025 and Summer 2026.
Part one: the research
Employee engagement and student engagement move together
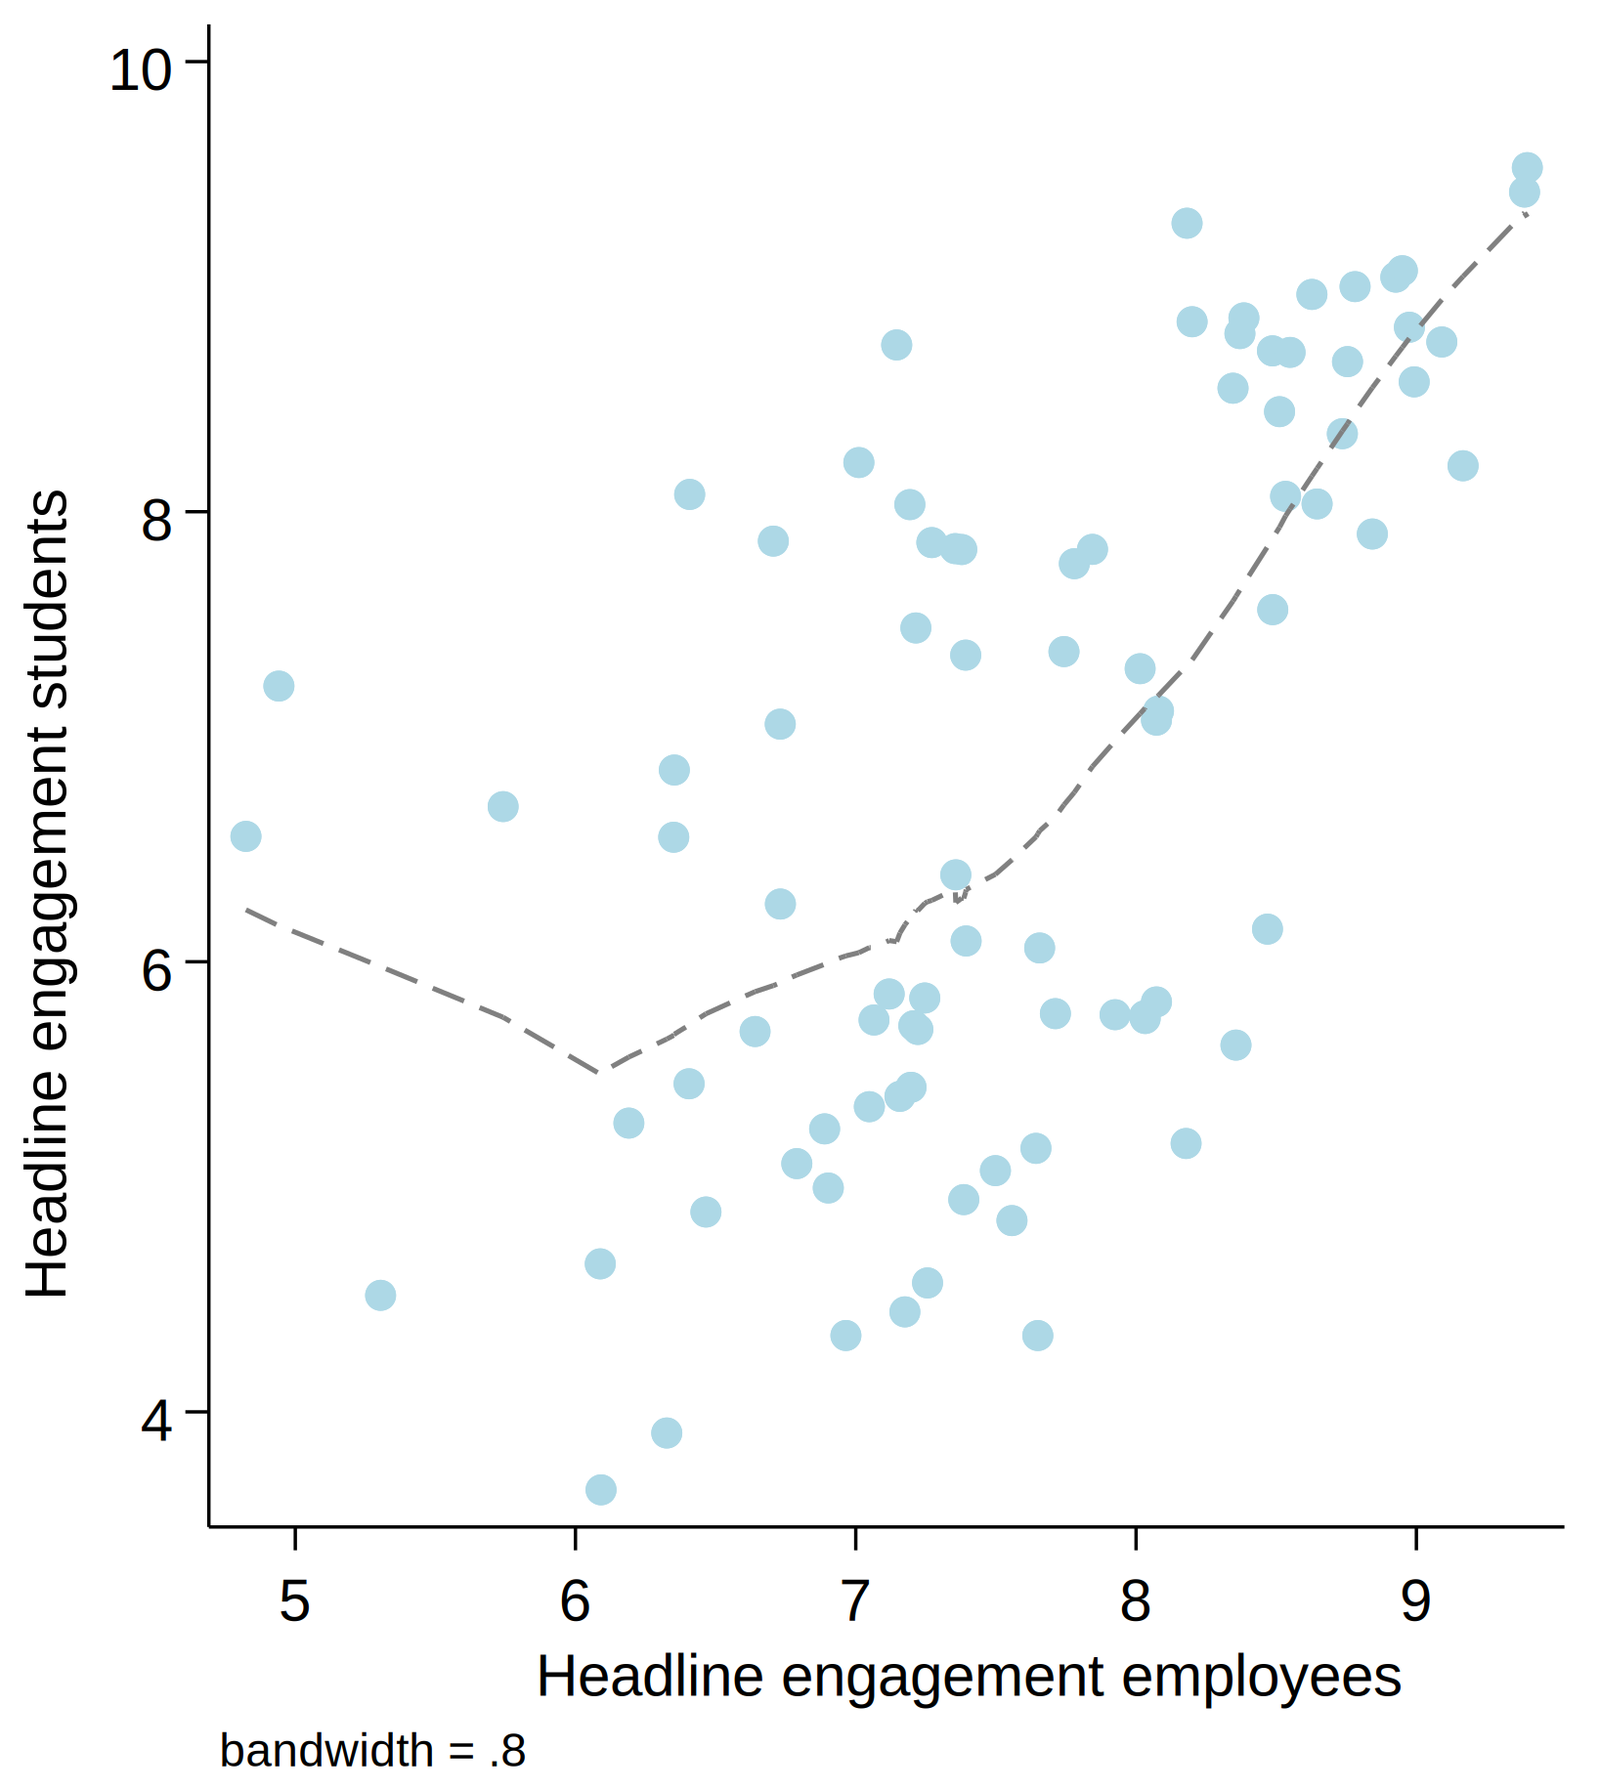
Mind the Engagement Gap, TEP’s research commission released in May 2025, drew attention to the steep drop in student engagement between Year 6 and Year 8. One of its other important findings was to highlight the link between employee engagement and student outcomes. Analysed by Professor John Jerrim, TEP’s Research Director, the commission drew on 81,283 students from Year 3 upwards across 200 schools in the March 2025 census, alongside employee data from the 85 schools where both were available.
At school level, employee headline engagement and student headline engagement are linked; where employees have higher scores, so do students. After controlling for phase, the proportion of students eligible for free school meals, ethnic composition and suspension rates, each one-point increase in a school's average employee engagement score was associated with a 0.5-point increase in its average student engagement score, and that stayed true after adding controls for historic absence, suspensions and Attainment 8.
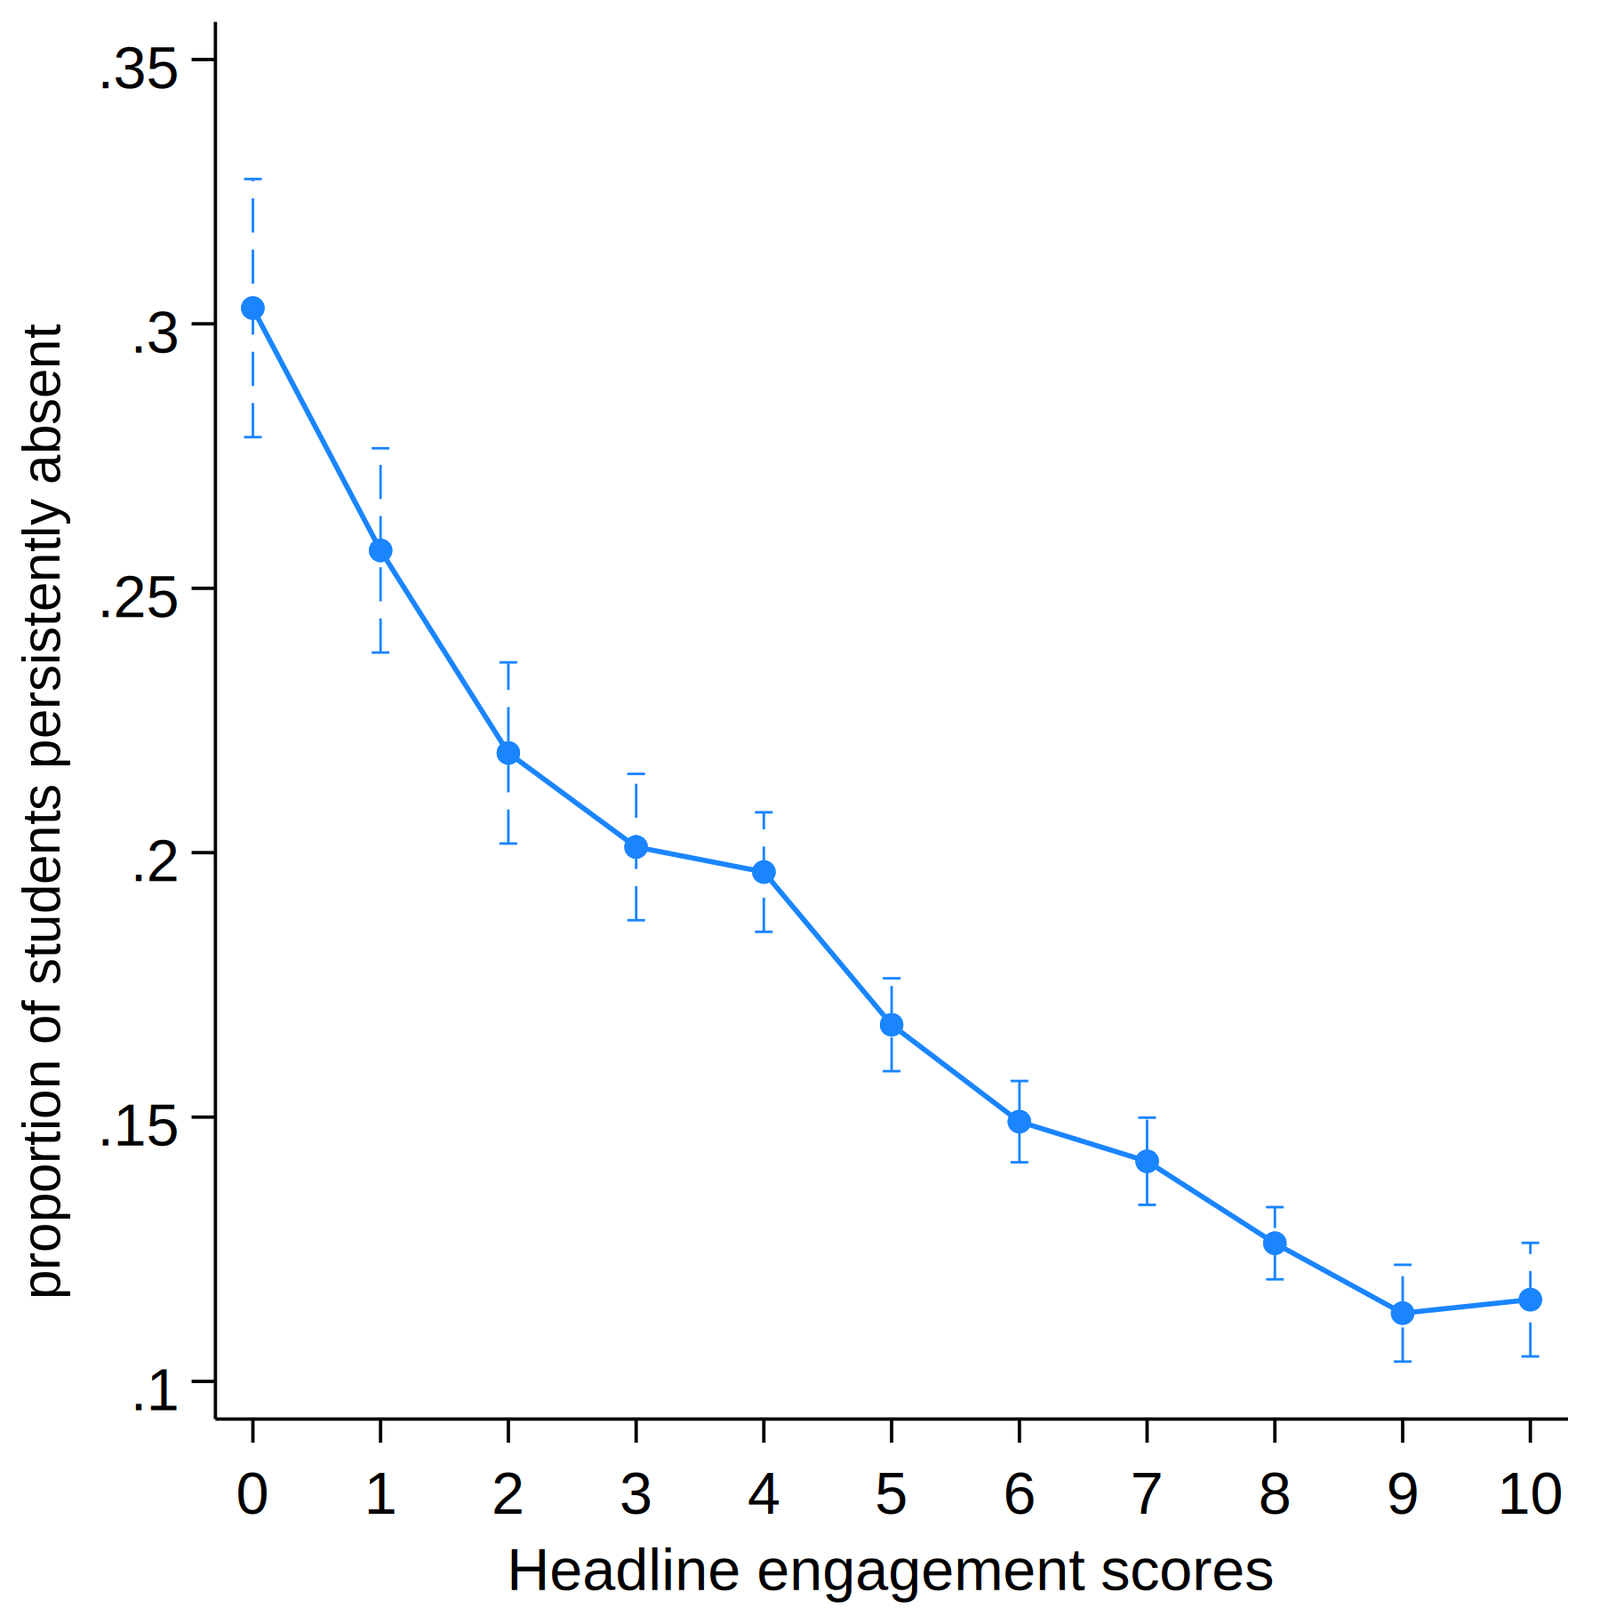
Mind the Engagement Gap also found that student engagement correlates with attendance. Among secondary students in the same school, in the same form group, with similar demographic characteristics, those with the lowest headline engagement scores had a 30% persistent absence rate; at a score of 9, that fell to just over 10%. Less engaged students were also more likely to arrive late, over and above their overall attendance rate.
Views of leadership has the strongest correlation with employee headline engagement
Professor John Jerrim analysed responses from 2,852 teachers to test which driver or question linked most closely to employee headline engagement. He found that one leadership question stood out: “We have a strategy that is taking this school in the right direction." Agreement with it was more closely related to the third headline question, “Overall, how satisfied are you working at this school?”, than any other driver or question tested.
When controlled for other drivers, buy-in was still the strongest working condition: almost twice as strongly related to commitment as good relationships with colleagues, and far ahead of satisfaction with workload or the belief that pay is fair.
Buy-in is not a measure of how good a strategy is. TEP’s strategy buy-in question is designed to measure whether the people delivering it understand it and believe it will work. This is reflected in TEP’s question sets, which are psychometrically validated question by question: each one is tested to confirm it measures what it claims to. That’s what makes a buy-in score of 6.5 mean the same thing in your school as it does anywhere else.
Buy-in also varies far more inside schools than between them. In that dataset, 77% of the variation occurred within schools and only 23% between them. Senior leaders averaged 8.5 out of 10; middle leaders averaged 6.7, while class teachers averaged 6.5. A comparison of the Autumn 2025 and Summer 2026 census data shows the gap widens as the year goes on: senior leaders become more positive while middle leaders become more negative. TEP’s research next year will look at why this gap widens.
Among teachers with low buy-in, around 70% scored their ability to voice a contrary opinion without fear of negative consequences at five or below; a quarter scored it between zero and two. The teachers least convinced by the strategy were also the least likely to say so out loud. Termly, anonymous check-ins, tracking specific questions, can be used to shine a light on less visible pockets of discontent.
Views of leadership predict job satisfaction, and at the bottom of the scale they predict departures
A second study followed over 4,000 school employees across three census points in a single academic year to track how changes in one individual's view of leadership relate to changes in that same individual's job satisfaction.
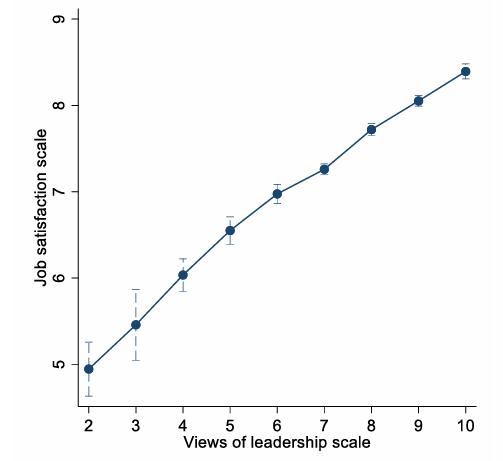
The data showed that an employee who rates leadership 9 out of 10 scores a full point higher on job satisfaction than a colleague in the same school who rates it 6. The relationship stayed consistent for teachers, senior leaders, teaching assistants and pastoral employees alike, and it was linear. Moving from adequate to good mattered as much as moving from poor to adequate.
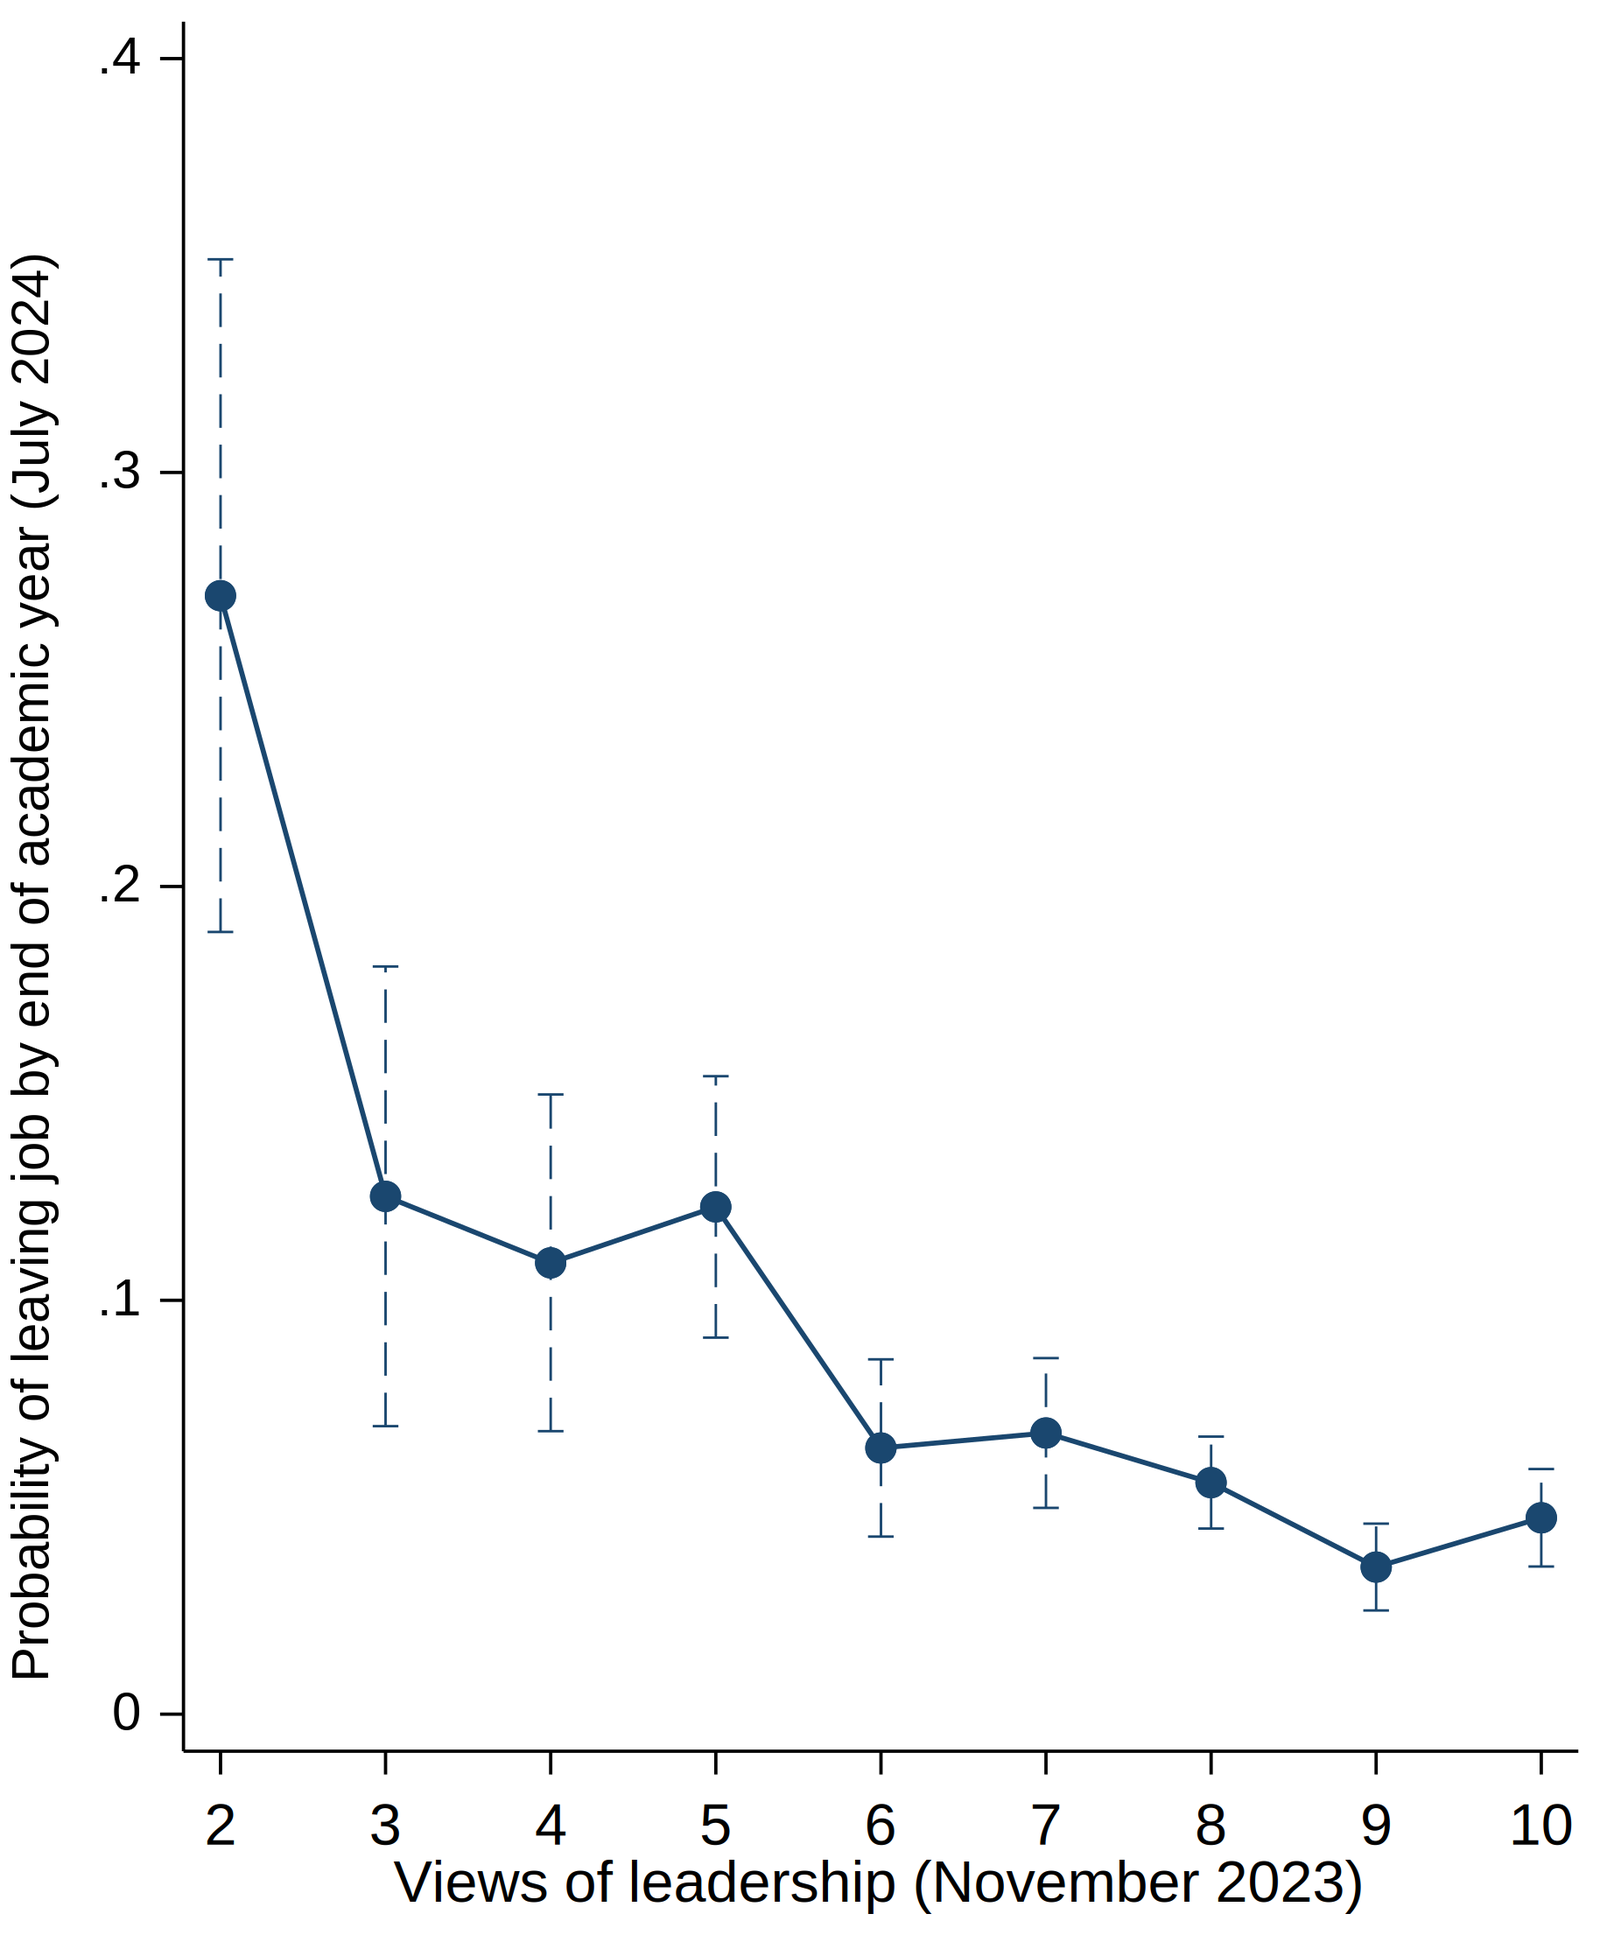
Retention behaved differently. Employees who rated leadership between 0 and 2 in November had a 25% chance of having left by the end of the academic year. For those rating leadership between 3 and 5, that fell to around 12%. Once the rating reached 6 or above, the chance of leaving dropped to roughly 5%, and the relationship became weak from there on.
Why three census windows are not three surveys
The most practically useful finding in Mind the Engagement Gap is about timing. Between November 2024 and March 2025, one term apart, average student scores fell across every driver with comparable data. Agency dropped 0.39 points; self-reported effort dropped 0.36 and headline engagement dropped by 0.20.
Almost all the headline decline came from a single year group: Year 7. Their headline engagement fell from 7.7 to 6.3 out of ten in just four months. Every other year group was broadly stable. Trust in teachers among Year 7 students fell by around 0.9 points over the same period, for boys and girls alike.
A school running one annual survey would see none of this. It would see a Year 7 score and, twelve months later, a Year 8 score, with no way of telling whether the drop happened in week three or week thirty. The termly cadence turns a number into a direction of travel, and a direction of travel is something you can act on before it becomes an attendance or attainment problem.
The same principle applies on the employee side. In each of the three schools below, termly data showed the leadership driver moving before headline engagement did (in two of the schools, it moved a full academic year before). That gap is the window in which a leader can tell whether a strategy is working, long before the headline number confirms it.
Part two: three schools, three contexts
In July 2026, TEP spoke to three headteachers whose schools recorded significant improvements in employee headline engagement between the Autumn 2025 and Summer 2026 censuses. They started from very different positions, but their approaches had clear similarities, and those similarities line up with the national research into strategy buy-in and employee satisfaction.
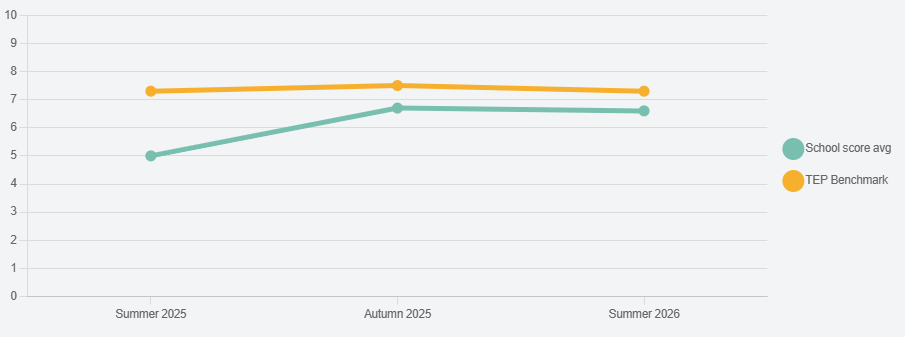
Christian Harris at Oasis Media City took over a secondary school of a little over 1,000 students in Salford in September 2025. The school sits in the bottom 1% nationally for social deprivation on every measure, including literacy, housing and health. It was 15th of 16 in the local authority for outcomes (although if Christian achieves his goals, it will soon be number 1), with around half of students achieving grade 4 and above, roughly 15 percentage points behind the national figure. It had had multiple headteachers in five years. Fifteen early career teachers started alongside him and Ofsted arrived in the December of that year. The TEP employee data waiting for him when he walked in was, in his words, "Quite stark and quite sad, which was upsetting to see,” with an average employee score 1.9 below the headline engagement benchmark and 2.3 below for leadership. Student scores were closer to benchmark, at 0.7 below. Following the June 2026 census, Oasis Media City has finished very close to the benchmark with a score of 7.0 – an increase of +1.5 in the space of three terms.
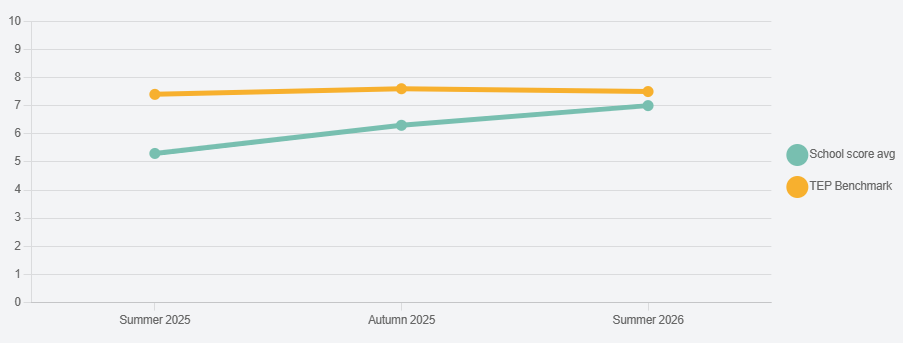
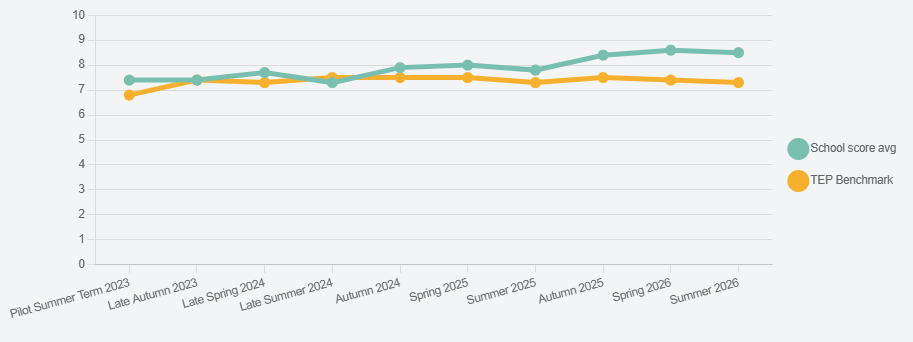
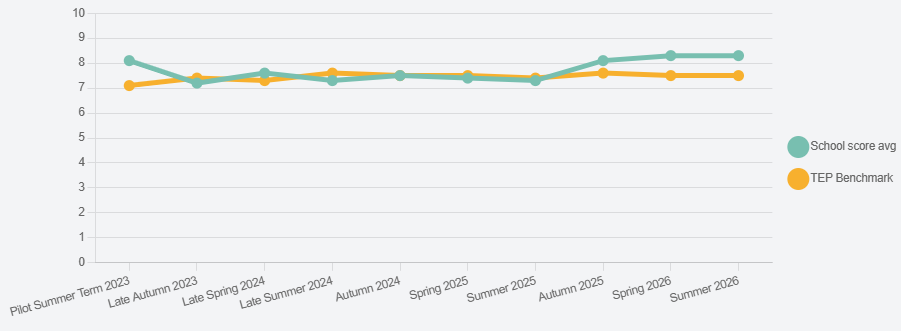
Andy Harris at Croxley Danes School became headteacher of this secondary school in Watford in September 2024. His inheritance appeared, on the surface, to be fairly healthy. The school was young, still absorbing the effects of its opening and then Covid, and carrying high turnover, including within the leadership team. Their average employee headline engagement score was right on benchmark at the time. Two years later, it’s 0.8 above.
Matt Morey at Lanchester Primary School became the eighth headteacher of an eleven-year-old primary school in September 2024, following a run of interim leadership. The whole leadership team turned over as he arrived, leaving him as the only leader in the building for his first six weeks. The school's TEP data was below benchmark before his appointment, with 80% of respondents in the bottom third of scores nationally in summer 2024. It’s a small school with around thirty employees, and an unusually diverse intake: White British students are the largest ethnic group, at about 22%.
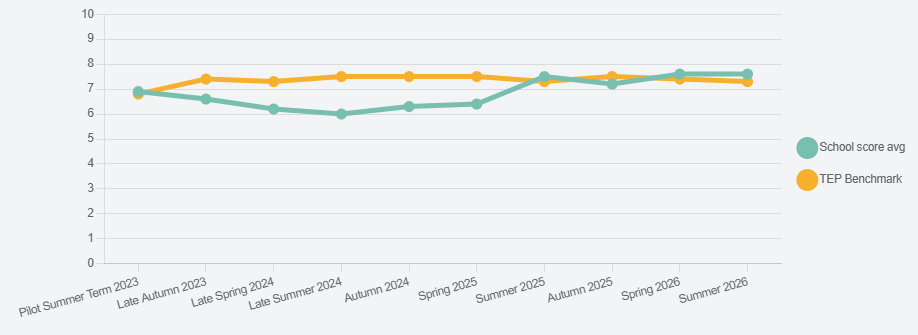
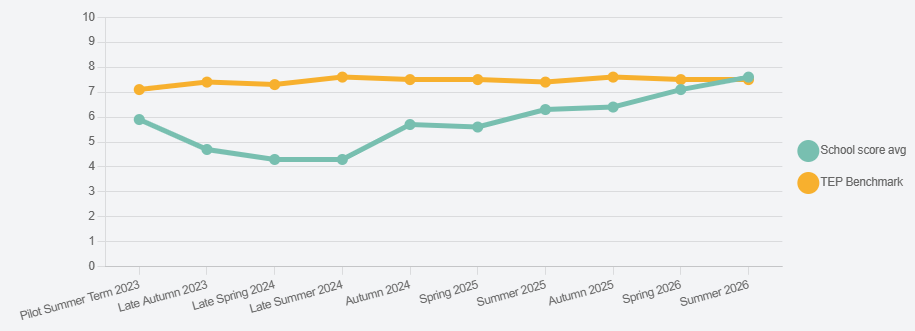
Although the contexts of the three schools are remarkably different in terms of phase, geography and starting point, they have one thing in common: their leadership scores improved ahead of their headline engagement scores.
Part three: securing strategy buy-in
We caught up with Andy, Christian and Matt to hear their reflections.
1. Consistency is key
All three heads independently described the same discipline: decide on a simple, memorable message and stick to it.
Christian ran his entire first year on two phrases, "we love year 11" and "126 for 2026", the number of students whose outcomes the school aimed to improve that academic year.
"My messaging is done already. So once I release that on inset day, that will just creep through the school for the entire year. I won't change my message. I won't bring in something new. I won't decide to jump onto something that I've just seen from the DfE or something that looks great next door."
Christian Harris
Andy works in threes: three strategic priorities (curriculum, inclusivity, and employee wellbeing and CPD) held constant across successive years, with a school development plan he could compress to a single page and an executive summary.
"My staff always take the mick out of me, because I always work in threes… really clear priorities, really clear strategic points."
Andy Harris
All three leaders were deliberate about how they communicated their strategy. Matt Morey cut communication rather than adding to it. He inherited a weekly whole-team meeting, a weekly leadership meeting, a Friday briefing and a daily email listing who was in, who was out and what had changed. He removed the daily email. When employees said they had lost track of the week, he reinstated a single Monday "week ahead" message and made a shared calendar the spine of the school.
"There's a race to do a million things in schools… being very organised and deliberate in what you change, and then saying no and protecting people from too many changes."
Matt Morey
His three core values, ready, respectful and resilient, were adapted with his team from Paul Dix’s Ready, Respectful, Safe, on the grounds that safety is an adult's responsibility to manage rather than a shared expectation. To make sure the new values had landed where they needed to, they were driven through assemblies three times a week in his first term, then dialled back once they had stuck.
2. Secure employee buy-in
Christian had access to employee and student data as soon as he took on his leadership role through the TEP partnership, meaning he could get a strong read on the picture at Oasis Media City. That let him identify the area to address first: behaviour. He made changes and secured employee buy-in by targeting the driver with the biggest difference from benchmark.
"We used TEP immediately. So when we came in, we grabbed all of the TEP survey to find out what the issues were… when you see your behaviour so low and when you see people's expectations, then that makes you ask the question. So we went to ask what was wrong with the behaviour systems."
Christian Harris
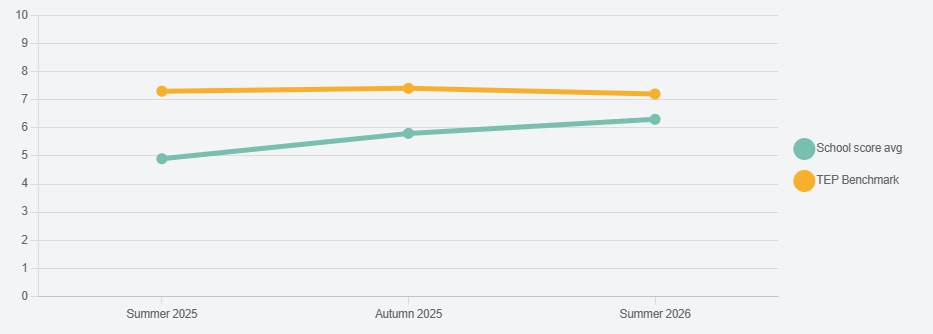
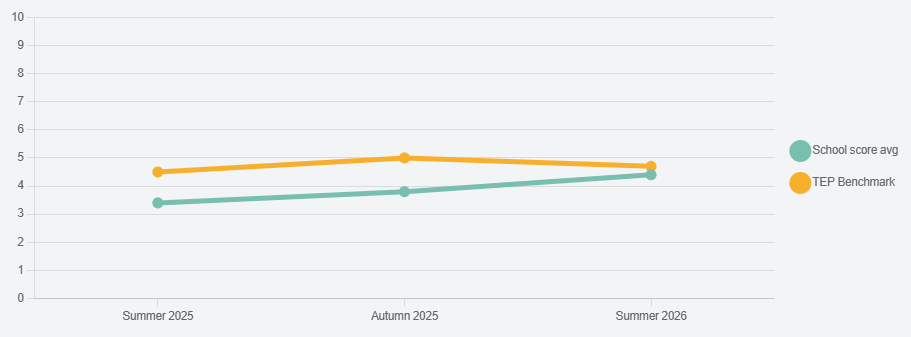
Matt had ten transition days before he started at Lanchester Primary school and was able to use them for the same purpose: gathering insights from his school community into their perception of their school. To continue to secure buy-in, he also introduces new ideas alongside employee feedback, before it becomes a school policy. He calls the approach the first follower, after a video he first saw during a national professional qualification.
An idea is soft-launched with a colleague likely to take to it, allowed to run visibly for a term, and only codified once someone other than the headteacher is advocating for it. To support his team with a new pedagogical policy, he ran a term of weekly meetings as lessons in retrieval practice, direct instruction, modelling and hinge questions, with no expectation attached. This was followed by teachers experimenting on their own; a formal set of eight expectations in January; coaching and drop-ins through the spring; and was embedded by summer.
"Get the right people on board and get them to sort of do the hard work for you, and they bring people to it."
Matt Morey
The same pattern is running now for a writing initiative. Two year groups have been chosen, one enthusiastic and one that will take convincing, to trial it in the autumn, with a whole-school conversation in January once colleagues have seen whether it worked. "It might not work, it might be an absolute failure, in which case we won't do it."
Andy at Croxley Danes School used release time from his previous school to spend a month before he started meeting the people: every head of faculty, every head of year, every member of the leadership team, other post holders, support employees.
"What I was seeking to do there… was just to listen and to make notes on what they thought the priorities were in the school, which in turn fed into the formulation of the three priorities… So what I was able to do on day one then was pitch that and say, you've helped me design this."
Andy Harris
Andy also used TEP data, alongside existing systems in school, to identify behaviour as a priority area. When he needed teachers to increase parental contact, he was upfront about a change in strategy.
"I'm going to be honest, this is probably going to increase your workload in the short term… but over time, because of that parental contact, I can guarantee you that it will reduce pretty rapidly in quite a short space of time."
Andy Harris
He then did three things that turned the promise into a system: built calling time into the directed time calendar, repurposed staff meeting time for it, and sat in the difficult parent meetings himself.
"We weren't just asking other people to do it. We were right there with them."
Andy Harris
Satisfaction with workload had almost no independent relationship with commitment once buy-in was accounted for. Employees who understand why the work is being asked of them, and can see leaders doing it too, absorb a great deal.
He also sequences the year deliberately. When TEP flagged behaviour as employees' biggest concern in his first term, he did not launch a response that half term. He ran focus groups, gathered more evidence, built the case, warned students and parents what was coming, and launched in January.
"You don't set big things in motion until you've got those natural pauses in the year and you're giving people time to assimilate the information and the time to plan… not trying to overload people and give them that time to process."
Andy Harris
3. Work with Middle Leaders
Senior leaders rate the school strategy at 8.5 out of 10 on average. Middle leaders rate it at 6.7. Most of the variation in buy-in sits inside schools rather than between them.
Christian Harris reflected honestly about how this looks in his school.
"I can't lead everything. It's impossible. There's no such thing as a super SLT team. It just doesn't exist. The school is led and driven and run from the middle… Nobody knows Science better than the Head of Science. Nobody knows Maths better than the Head of Maths."
Christian Harris
Structurally, he made one change that did a lot of work: his deputy for quality of education line manages English, Maths and Science together, rather than the three core subjects being split across the leadership team. This shift results in one set of meetings, one point of challenge, and alignment between the core subjects. Alongside that, curriculum leaders got meeting time with each other that they had never had. Next on the timetable are "joining the dots" sessions, brought over from his previous school, where departments look at the same students' data together and agree interventions in the room.
"This is why we're doing this. Show me your data, show me this data… And action gives you clarity, doesn't it? Once you take action, you get clarity."
Christian Harris
He is also honest that the pace varies. "Some curriculum leaders have taken longer than others, but that's just life, isn't it… More conversations, more references to the data."
At Croxley Danes, Andy Harris solved the same problem through the sequencing of information. Middle leaders are briefed on the TEP results first, before the whole employee body, and are then guided to interrogate their own department’s data.
"They're encouraged and guided to interrogate the results for their own areas of responsibility as well… they get to see themselves where the concerns are, but also where the wins are as well."
Andy Harris
Senior leaders have platform access; each line manages a department area and works through the detail in line management. Middle leaders receive the breakdown rather than the platform, which keeps the conversation focused on their own area and on what they can change.
Behaviour was a live concern across the school, and the senior and middle leadership teams were able to target their response: more corridor presence, department-level rewards and incentives, extracurricular clubs, and a push on students buying into lessons. English is his sharpest example:
"Previously they were one of our lowest scorers overall in TEP in terms of satisfaction. There were a lot of concerns about behaviour, a lot of concerns about workload, a lot of concerns around peer relationships within the faculty, concerns over leadership as well. And within the space of a year, they actually went to one of the strongest."
Andy Harris
He attributes that to not only being listened to, but being able to use TEP’s benchmarking to identify where the conversation needed to start.
4. Use TEP as a feedback loop
None of these three leaders sits down to a forensic re-analysis after every census. What they do is lighter and more repetitive.
Matt Morey front-loads every window:
"I always front load it, so before the survey comes up, I always talk a little bit about what you said last time, what we've done about it this time."
Matt Morey
That short habit changes what the census is: instead of being a request for data, it becomes visible evidence that the last survey contributed to something. Two of his concrete changes came from comments rather than scores. Support employees expressed frustration about the value of their work, feeling they were following children around rather than improving learning. The response was a half-day of CPD in January on accessing ready-made teaching resources, timetable changes to create the space to use them, a review in June, and further training on a second programme. From September, they will be shown how to identify specific students with specific gaps and choose who to work with.
"So all that came about predominantly from the TEP survey, really, from their feedback on that about value of their work and what they thought they were doing."
Matt Morey
The second example was a decision not to change something. A revision to the marking policy was on the table until workload came up in the comments. The revision was shelved and the policy kept basic.
He is also clear about the limits. "It's been tricky when we're doing specific things because it doesn't give you specific feedback. But the comments do." Leaders are now able to add custom questions to their question sets, which will let him ask directly about the impact of a specific CPD programme or a new initiative.
Andy Harris uses TEP earlier in the cycle, as the mandate for change rather than the verdict on it.
"Show the rationale and the intent. Why are we doing it? TEP is a big part of that. You're telling us this is stopping you from doing your job. So we're proactively doing something about this."
Andy Harris
Christian Harris is careful to frame his community’s responses to TEP against the context of day-to-day life at school.
"I take the TEP survey with a pinch of salt. If you answer it on a good day, you're probably going to write something nice… it's a great insight and it is lovely to see it going up from last summer, because last summer made me really sad…"
Christian Harris
Any individual response can be coloured by mood or grievance, which is why the reading that counts is the pattern across a whole employee body and across census points. That’s what Christian did with behaviour. He triangulates deliberately, checking whether the TEP results line up with the other surveys and measures the school uses, and monitoring the direction of travel.
"Lasting behaviour change takes time. And you've got to back the systems, you've got to invest in the systems, you can't say they don't work immediately. We need 12 months to run them through."
Christian Harris
5. Triangulate engagement data with other outcomes
Every one of these leaders reads TEP alongside a wider set of measures, and in each case the wider set moved too.
Christian Harris, Oasis Media City. Detention attendance rose from 15% to 97% across the year. On-call responses answered by the pastoral team rose from 50% to 93%. The pastoral team went from 5 to 9, in a school that had grown past 1,000 students without ever growing its pastoral capacity. Alongside that: a fully funded four-day Year 7 residential, Year 10 and 11 revision residentials, and theatre and STEM experiences. In the TEP data, employee views of behaviour tracked headline engagement almost exactly, and employee agency scores rose over a period in which the national average for agency fell.
Andy Harris, Croxley Danes School. Employee turnover fell by 40% in a single year. Internal truancy, once a significant problem, has been all but eliminated, having been reduced by around 75% in the first half term through simple, clear systems. Suspension rates fell to well below national. Attendance is up and above national. An independent external review and the parent response to the Ofsted survey pointed the same way. He is careful not to overclaim: "I'm not suggesting that's all down to the changes we've made, but it's definitely a correlation there."
Matt Morey, Lanchester Primary School. Nobody left at the end of his first year. Two people are leaving at the end of this one. Teacher attendance improved markedly after optional fortnightly blocked PPA was introduced in September 2025, with take-up of the offer growing through the year as colleagues watched each other use it. Academic outcomes were the school's best on record last year, and almost all of them have been matched or beaten this year, with 97% in the phonics screening check, 83% reaching a good level of development in Reception, and two thirds of students scoring full marks in the multiplication check.
Matt's school also illustrates a common observation from school leaders: perception sometimes lags behind reality. His headline engagement score stayed flat for a long stretch while scores in other drivers, and school outcomes, climbed. Four ECTs had recently spent time on placement at another school. Curious, he asked them which school they would rather work in; they were adamant it was Lanchester.
"And I just said, is it that bad here or are we stuck in the past? Are we still worried about transitions and changes? I said, look at your outcomes. I said, ‘None of you've left, you're still here’."
Matt Morey
His own read on it, a minute later in the conversation, was that "I think we've got better over 2 years, but no one's really noticed."
"This is a great school. It's not the wobbly, inconsistent, worry about it school."
Matt Morey
That is a leadership act rather than a data act. But it was the data, his scores set against a benchmark, that made the conversation possible.
Five things to take into the new year
1. Test whether your strategy is understood.
Most of the variation in buy-in sits inside schools, not between them. Your strategy may be sound and still be poorly understood two layers down, and it’s the understanding that predicts whether people stay. Dig into every group separately with a focus on buy-in to strategy and ability to voice a contrary opinion; keep an eye out for advocacy as well as pockets of discontent.
2. Watch the leadership driver and treat it as your early signal.
In all three of these schools, the leadership driver moved before headline engagement did. In Croxley Danes and Lanchester, headline engagement took a full academic year to catch up. If your leadership scores are rising and your headline number is flat, that’s the sequence working, and it’s the evidence you need to keep your nerve on systems that take twelve months to embed.
3. Brief middle leaders first and give them their own data.
Senior leaders nationally rate strategy at 8.5. Middle leaders rate it at 6.7. Handing middle leaders their own faculty or phase breakdown, and then asking what they can do about it, builds ownership of engagement at every level. It also produces better answers, because they know their area better than you do. You can grant middle leaders TEP access and restrict their permissions to view only their department – watch this video to find out how.
4. Front-load the census with what’s changed since last time.
Briefing stakeholders in the week before each census, and reminding employees and students that their feedback has been used to drive decisions, was the highest-return use of TEP any of these three leaders described. It raises response rates and improves the quality of comments. Be honest when your answer was that you heard the feedback and chose not to act: shelving a marking policy revision because workload came up in the comments is a legitimate response, and a visible one.
5. Read patterns and trends.
None of these leaders performs a full re-analysis after each window. They look at direction of travel, at where one group's line diverges from the rest, and at the free-text comments. The termly cadence is what makes that possible. Student engagement fell across every driver between the Autumn and Spring censuses, and almost all of that came from Year 7. An annual survey gives you a number. Three windows show you when it moved, and therefore what to do about it.
Note on TEP methodology: all scores are reported on a 0–10 scale and benchmarked against schools responding to the same validated questions in the same census window. A difference of 0.3 points or more against the national benchmark is considered significant. Response rates are reported alongside every score; the studies referenced here drew on employee response rates of around 75% to 81% and a student response rate of 74%.
Research referenced: Jerrim, J. (2024), "The link between teacher buy-in and commitment to their school"; Jerrim, J. (2024), "The link between school leadership, staff job satisfaction and retention: longitudinal evidence from England"; Jerrim, J. (2025), "Mind the Engagement Gap: a national study of student engagement in England's schools".