




What we've learnt about school engagement 2025/26
TEP has been measuring pupil engagement across England since the RCELI (Research Commission in Engagement as a Lead Indicator) launched in Autumn 2024: we’ve had six termly censuses so far, run in the same three national windows every year, in November, March and June. Every school answers the same validated question sets across the same 3 week window through a shared framework covering pupils and employees, with families added last academic year. How this process has evolved can be found here: /How the Pupil Engagement Measure Was Developed| The Engagement Platform
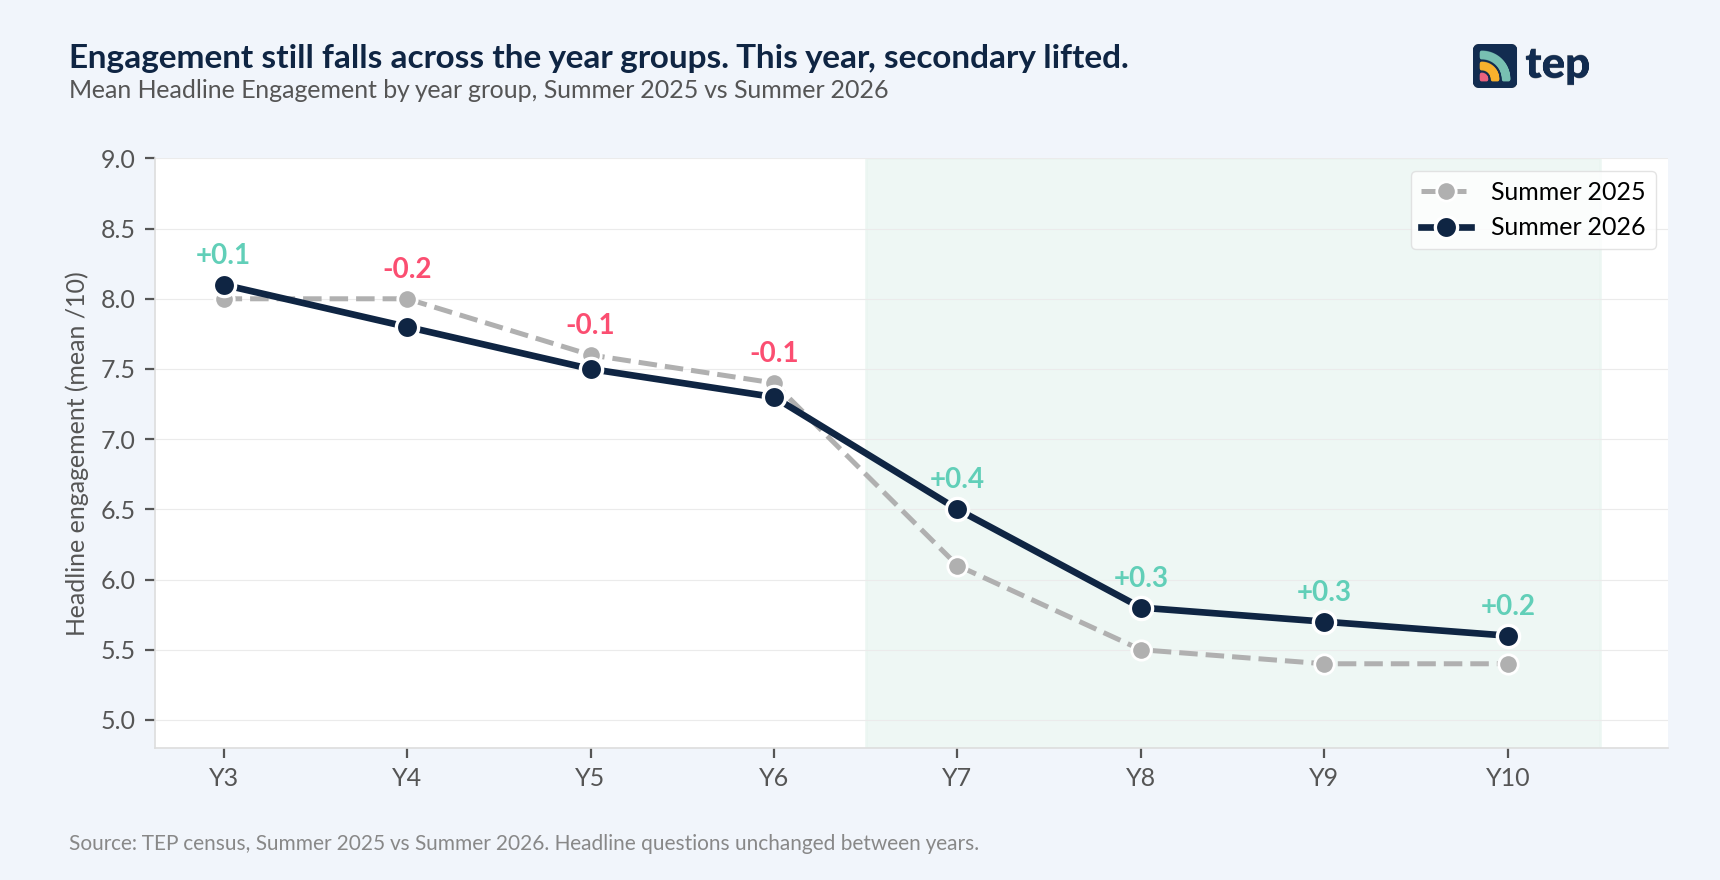
Measuring against the same question set 3 times a year at precisely the same time allows us to compare the data in the ways that makes a difference. In 2025/26, pupil engagement rose, compared to the year prior, in the schools that measure it with TEP, Year 7 was again the year group that loses the most, and pupil, employee and family engagement across similar sentiments seems to be strongly aligned. This blog walks through five findings from this data and gives some insights into what three headteachers did this year once they engaged in their TEP data.
Schools using TEP saw pupil engagement rise year on year
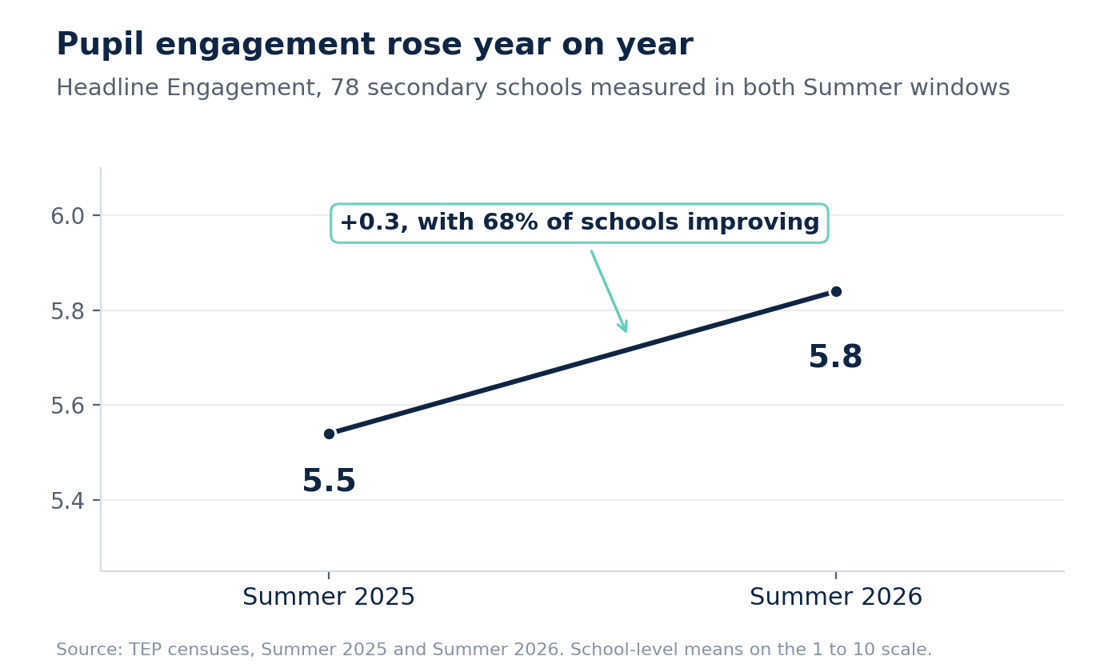
Across the 78 secondary schools that completed the pupil engagement census in both the Summer 2025 and Summer2026 windows, the average Headline Engagement score rose from 5.5 to 5.8 out of 10 on the same questions. 68% of schools improved, with increases seen across every year group. While this is an initial finding, by measuring the same schools against the same framework and questions over time, we are beginning to see the impact schools using TEP are having.
Year 7 arrive the most engaged,but much of it is lost by summer
Pupils begin Year 7 with the highest engagement of any secondary year group, and by the end of the year they have lost 0.9 points on average, around three times the decline seen anywhere else in the school. The fall is already clear between the November and March censuses, a period in which transition support potentially begins to taper.
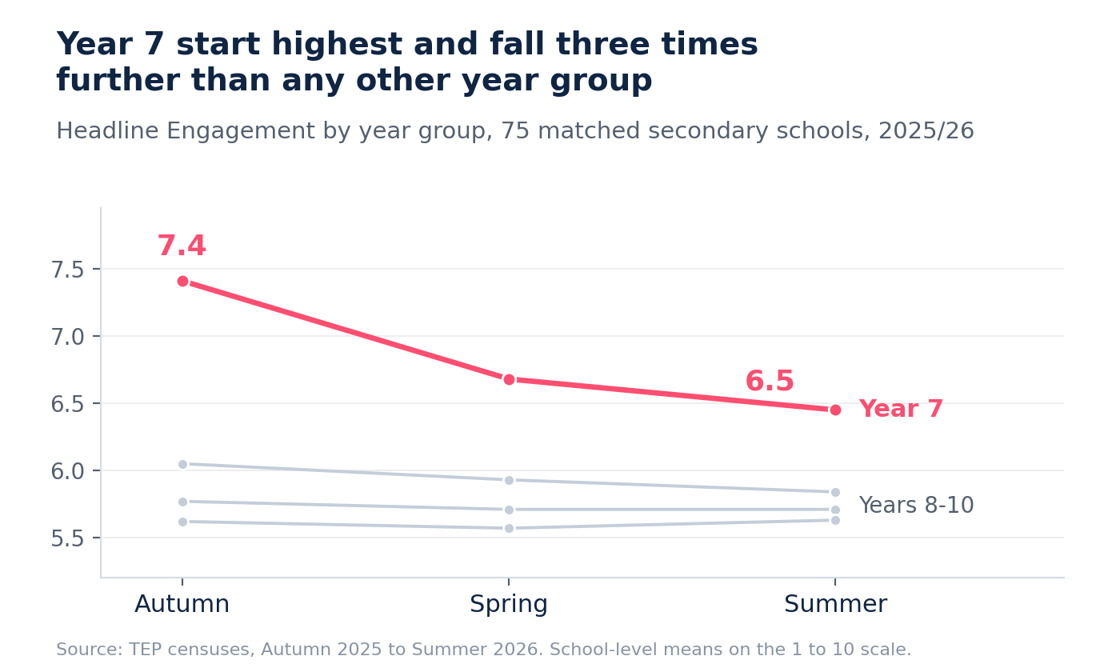
This is now a repeated pattern rather than a one-off. Our research commission Mind the Engagement Gap found the same shape in the previous cohort: between the November and March censuses, Year 7 headline engagement fell from 7.7 to 6.3 while every other year group held broadly stable. What can look like a drop between Year 7 and Year 8 may actually be happening much earlier, within the first months of Year 7, which may change where transition support belongs: less an induction fortnight, more a year-long piece of work.
Engagement follows a pattern across the year, so Spring is best judged against Spring
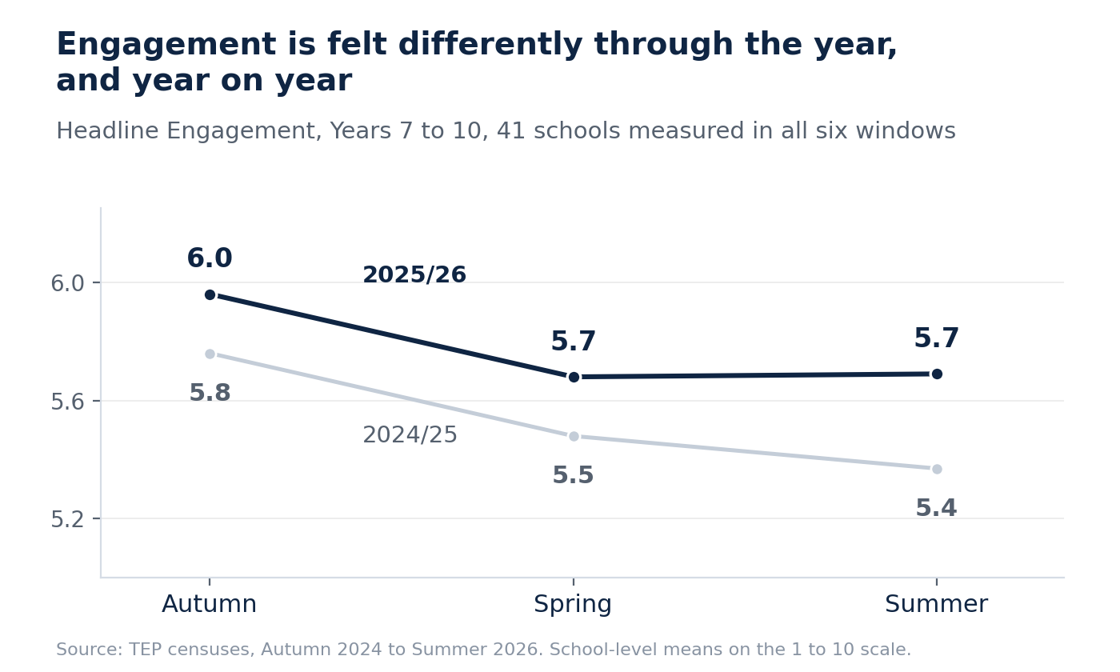
In all the schools measured in every census window across both years (2024/25 and 2025/26), engagement runs highest in Autumn and falls into Spring, and the whole curve sat higher in 2025/26 than the year before. The two years diverged at the end: last year the same schools kept slipping into Summer, while this year they held level. The Spring dip appears each year, which suggests it is part of a wider national pattern rather than a school necessarily going backwards, and it is why TEP gives each termly census window its own benchmark. A Spring result read against an Autumn baseline will give a misleading impression of decline; read against comparable schools’ Springs, you can be confident it gives an accurate view of that cohort at that moment in the academic calendar. Whether Year 11 are sitting their mock exams or Year 6 are preparing for their SATs, everyone in a year group is going through roughly the same thing at the same time.
Different aspects of engagement are linked to different pupil outcomes
TEP breaks pupil engagement down into eleven distinct drivers, capturing how pupils think, feel and act in relation to school. All drivers can affect different pupil outcomes in different ways, but at the end of 2025/26,Behaviour and Safety showed the strongest links to attainment, while Safety and Effort were most closely linked to attendance, and those relationships held after accounting for differences in school intake. Peer relationships were also a strong driver associated with girls' attendance, which you can read in more detail here: /Peer Relationships, Gender and School Absence| The Engagement Platform
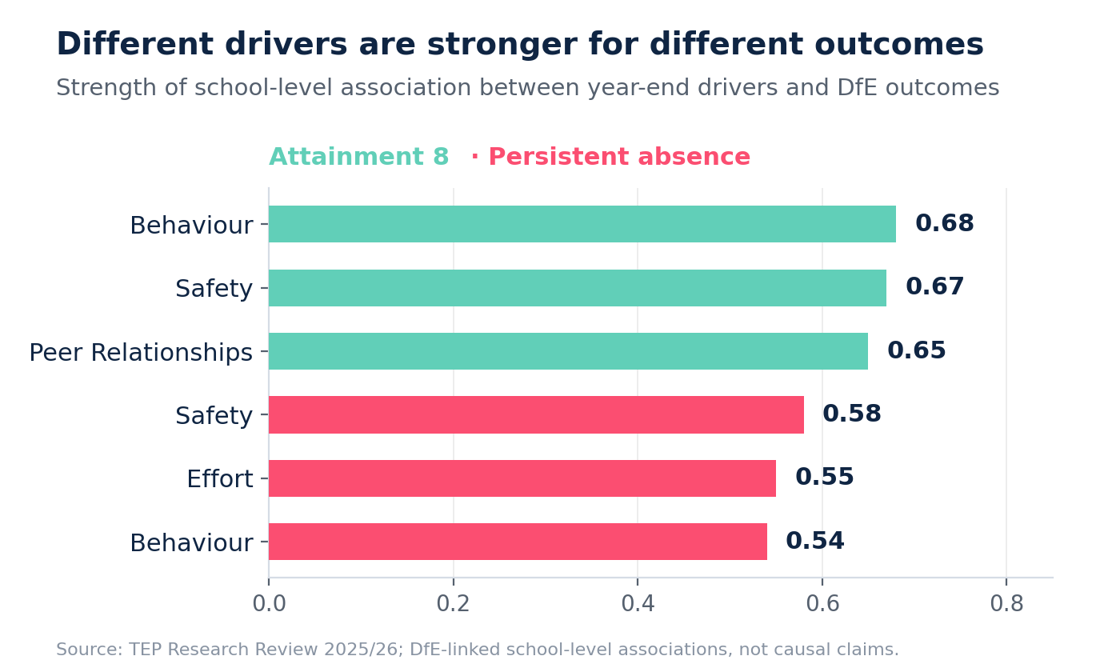
Among secondary pupils in the same school and form group with similar characteristics, those with the lowest Headline Engagement scores had a persistent absence rate around 30% - where the score was a 9 or above, PA fell to just over 10%. Engagement is associated with these outcomes rather than proven to cause them, but the associations are strong, consistent, and, most usefully, they move early. However, engagement is not one single thing, and that is what makes measuring our distinct drivers practical - pinpoint where improvement is needed, then focus on the aspects of engagement most closely associated with your improvement priorities.
Pupils, employees and families give a consistent picture of the same school
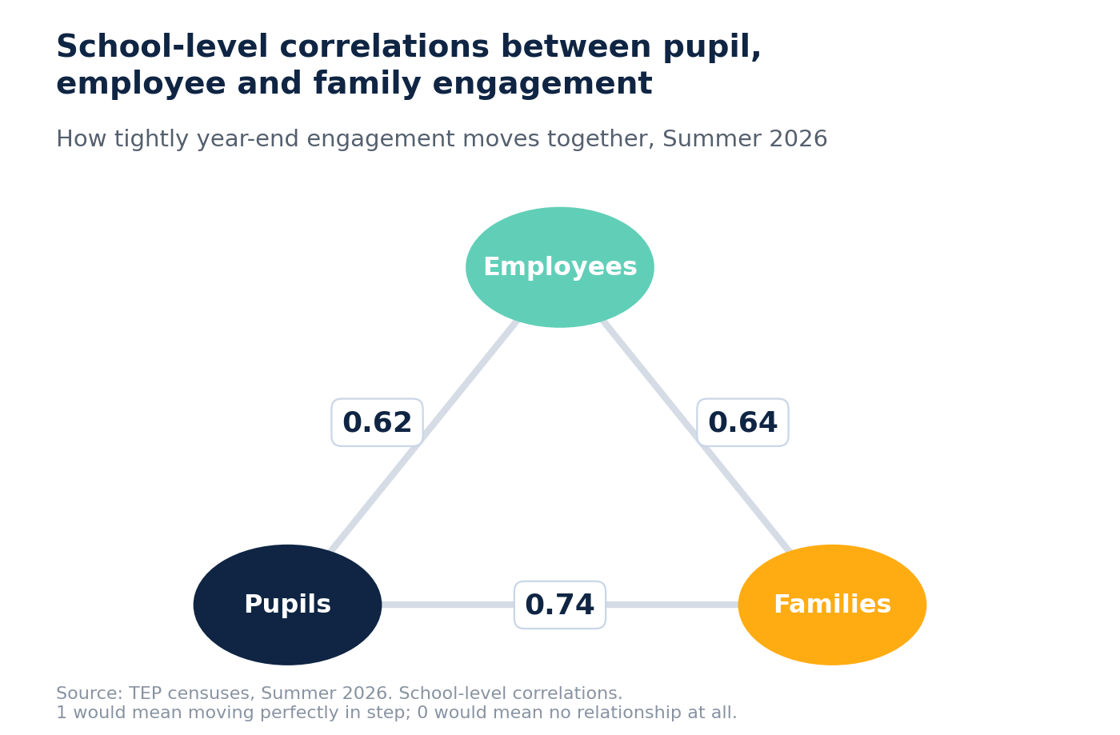
Schools with more engaged employees also tended to have more engaged pupils at year end, with family engagement following the same pattern. The three groups’ scores move together tightly on a scale where 1 would represent a perfect correlation and 0 no relationship at all: 0.62 between employees and pupils, 0.74 between families and pupils, 0.64 between families and employees. Looking at Data across hundreds of schools, links this consistent suggest the three groups are not describing separate experiences; they are picking up on common features of the same school.
This holds up under stricter tests too. Analysis drawing on 81,283 pupils across 200 schools found that after controlling for phase, free school meal eligibility, ethnic composition and suspension rates, each one-point rise in a school’s average employee engagement was associated with a 0.5-point rise in its average pupil engagement. Three groups, asked separately, are describing the same school, which is why TEP measures them through one shared framework rather than three unrelated surveys.
The three headteachers we spoke to this July show what that looks like inside a school. At Oasis Media City in Salford, Croxley Danes School and Lanchester Primary School, employee engagement rose by a point or more against the national benchmark across the year: Oasis Media City started 1.9 points below the benchmark and closed the year within touching distance of it, Croxley Danes went from sitting on the benchmark to 0.8 above it, and Lanchester Primary started 1.5 points below and ended within 0.2 of it. In each, the leadership score moved before headline engagement did, in two of them a full year before. And when the data at Oasis Media City showed Behaviour furthest from the benchmark, that became the first priority, and both employee and pupil behaviour scores rose over the year that followed. Christian Harris, who took over Oasis Media City in September 2025, put it simply: “We used TEP immediately. So, when we came in, we grabbed all of the TEP survey to find out what the issues were.” Read together, the three groups tell a leader where to start; read termly, they show whether it is working.
More to come
We are walking through these findings, and what sits behind them, in a webinar on Monday 28 September at 3.45pm: sign up here: /The State of School Engagement in England: Looking ahead to 2027